Pattern Detection in Real-Time Online Poker Using Data Visualization
Written by Carlo Hughes · Jul 29, 2026
Pattern Detection in Real-Time Online Poker Using Data Visualization
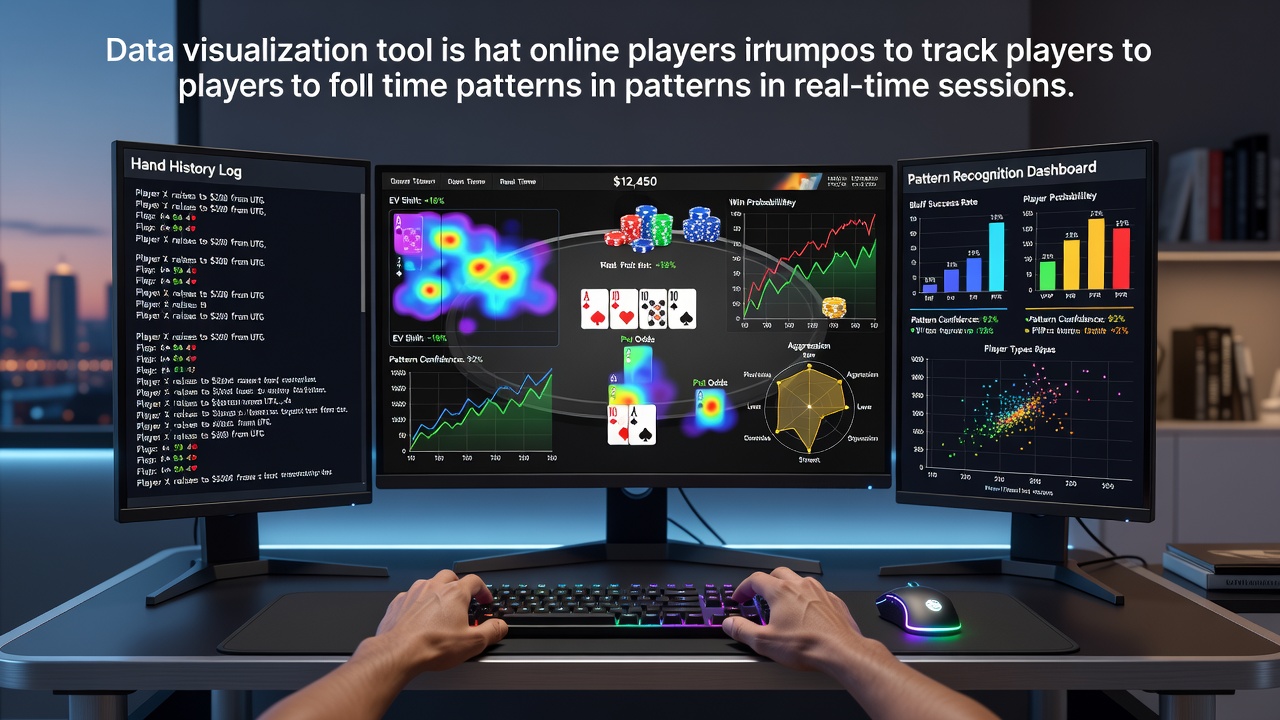
Online poker platforms generate massive volumes of session data every minute, and visualization tools convert those streams into graphs, charts, and heatmaps that update live. Players access these displays through heads-up display overlays and integrated analytics panels that sit alongside the table interface. Research from the University of Nevada shows that structured visual summaries help participants monitor variables such as voluntary put-in-pot percentages, aggression factors, and positional win rates without pausing to calculate numbers manually.
Core Components of Poker Visualization Systems
Modern tools pull data from hand histories in real time, then render line graphs for stack trajectories, bar charts for action frequencies, and color-coded tables for range breakdowns. Software records every bet size, timing tell, and showdown result, then displays trends across hundreds of hands within a single session. Observers note that these systems often combine multiple metrics on one screen, allowing quick cross-referencing between an opponent's three-bet rate and their continuation-bet success on different board textures.
Heatmaps appear frequently in these interfaces because they translate complex range data into intuitive color gradients. A red zone might indicate heavy betting frequency from early position, while cooler shades show folding tendencies. By July 2026, several major platforms had added animated transitions that highlight shifts in player behavior as new hands arrive, making pattern changes easier to spot during active play.
Real-Time Pattern Tracking Mechanisms
Visualization software tracks sequences such as check-raise frequencies after specific pre-flop actions, then plots those sequences against board types adn stack depths. Players see scatter plots that cluster similar situations together, revealing whether an opponent tends to over-bluff on monotone flops or under-defend versus large river bets. Data flows continuously from the server to the client, so each new action refreshes the visual elements without requiring manual refreshes.
Line charts display running win-rate trends filtered by position or hand category, while pie charts break down showdown winnings by hand strength. These displays connect directly to database logs that store every hand from the session, enabling filters that isolate patterns across different time windows within the same game. Researchers at the University of Sydney have documented how such filtering reduces the cognitive load of recalling past hands from memory alone.
Integration with Session Management Features
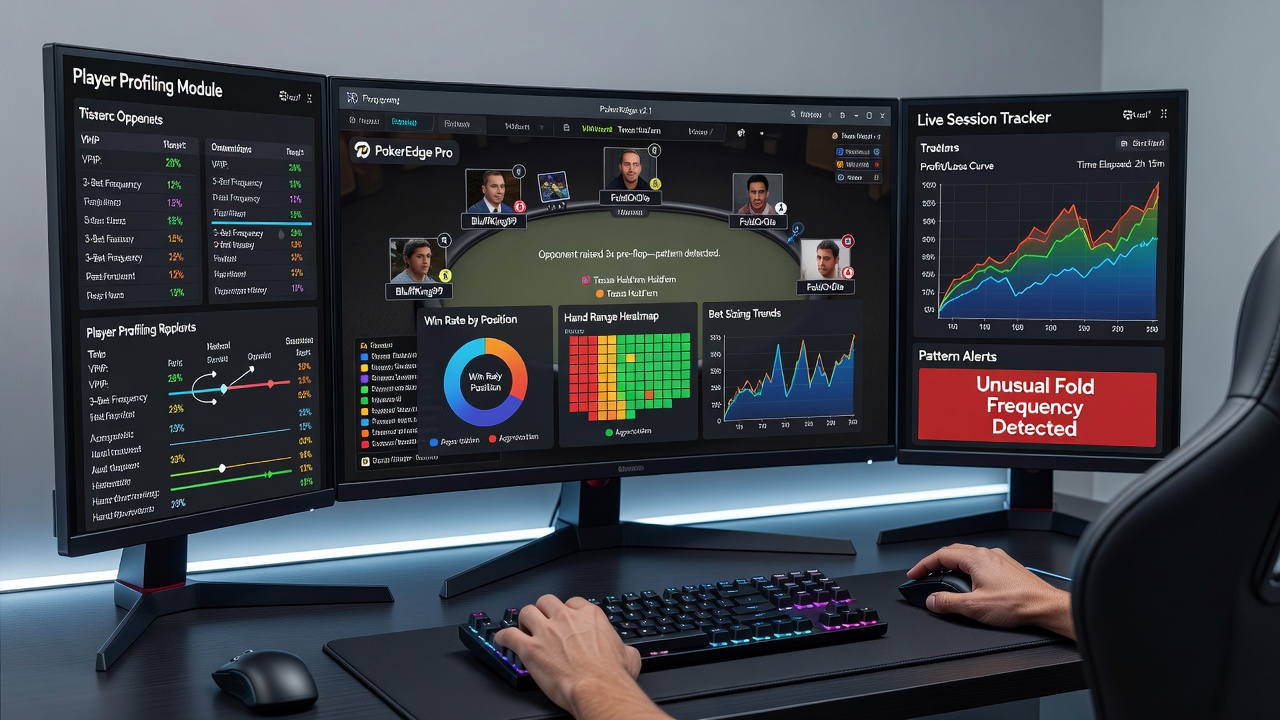
Many visualization suites include session timers and bankroll graphs that overlay directly onto the poker client. These elements update after each hand, showing profit and loss curves segmented by table or by stake level. When a player switches tables mid-session, the software merges data streams so that aggregate patterns remain visible across all active games. External reports from the Canadian Gaming Association indicate that synchronized data feeds help maintain consistent tracking even when session length exceeds several hours.
Alert systems built into the visualization layer flag deviations from established baselines. A sudden spike in fold-to-three-bet percentage might trigger a highlighted notification on the dashboard, drawing attention to possible adjustments by an opponent. These alerts rely on statistical thresholds set by the player or by default profiles, and they operate without interrupting the flow of play.
Data Sources and Accuracy Considerations
Visualization accuracy depends on the completeness of hand history exports provided by each poker network. Some sites deliver full hand data including hole cards at showdown, while others limit exports to observed actions. Players often combine data from multiple rooms into a single database, allowing cross-site pattern analysis. Industry organizations such as the European Gaming and Betting Association have published guidelines on data formatting that support consistent import into visualization tools.
Security protocols encrypt the data streams between the poker server and the analytics client, protecting both account details and session statistics. Regular software updates address changes in network APIs, ensuring that charts continue to populate correctly after platform modifications. Those who maintain local databases back up files periodically to prevent loss of historical pattern records.
Conclusion
Data visualization tools translate raw poker session logs into accessible visual formats that support ongoing pattern monitoring. Charts, graphs, and heatmaps refresh continuously during play, presenting frequency data, trend lines, and positional breakdowns in one consolidated view. As platforms evolve through 2026 and beyond, the integration of animated elements and multi-table aggregation continues to expand the scope of information available to participants who rely on these systems for real-time decision support.